Woooow! GelSight offers various new research opportunities, for example....
This unique measurement system can help to analyse the surface patterns in the firearms and toolmarks identification. Nowadays, the forensic experts investigate these surface structures in 2D and I think the 3D comparison of these patterns can provide more exact identification process in the law enforcement.
Showing posts with label data. Show all posts
Showing posts with label data. Show all posts
Saturday, August 13, 2011


Sunday, May 9, 2010
Spatial analysis of the Bronze Age sites of the region of Paphos in southwest Cyprus with the use of Geographical Information Systems - CAA
Surface analysis is also a very popular research area in GIS/Archaeology. I want to write more about Least-Cost Analysis in GIS later.
This work was mede by:
University of Cyprus, Archaeological Research Unit and Laboratory of Geophysical – Satellite Remote Sensing and Archaeo-environment, Institute for Mediterranean Studies, Foundation for Research and Technology

Part of Introcuction:
"The paper aims to study the Bronze Age site
distribution in the region of Paphos in SW Cyprus in
order to interpret site patterns. In the context of the
Paphos pilot project, entitled, “A long-term response
to the need to make modern development and the
preservation of the archaeo-cultural record mutually
compatible operations” (IACOVOU et al. 2009),
spatial analysis was performed, with the use of
Geographic Information Systems (GIS), on sites of
the Early, Middle and Late Cypriot period (3rd and
2nd millennium BC) that have been reported from
the region to this date...."
This work was mede by:
University of Cyprus, Archaeological Research Unit and Laboratory of Geophysical – Satellite Remote Sensing and Archaeo-environment, Institute for Mediterranean Studies, Foundation for Research and Technology

Part of Introcuction:
"The paper aims to study the Bronze Age site
distribution in the region of Paphos in SW Cyprus in
order to interpret site patterns. In the context of the
Paphos pilot project, entitled, “A long-term response
to the need to make modern development and the
preservation of the archaeo-cultural record mutually
compatible operations” (IACOVOU et al. 2009),
spatial analysis was performed, with the use of
Geographic Information Systems (GIS), on sites of
the Early, Middle and Late Cypriot period (3rd and
2nd millennium BC) that have been reported from
the region to this date...."
Friday, March 26, 2010
Aerotec Provides Airborne LIDAR for IBM’s
"Aerotec, LLC recently provided airborne LIDAR (Light Detection and Ranging) for IBM's "Smarter Planet" series of videos. “Data Anthem” was produced by Ogilvy & Mather New York and directed by James Frost of Zoo Films. Aerotec's airborne LIDAR was used for the opening scene and some of the follow-on scenes. The videos sought to use the most compelling, arresting ways of visualizing actual data to complement the message of the importance of data, the context for its proliferation, and the enormous opportunities that lie within it....."
great video: http://www.youtube.com/watch?v=3cj6VtYpBI4

source: http://www10.giscafe.com/nbc/articles/view_article.php?section=CorpNews&articleid=804303
great video: http://www.youtube.com/watch?v=3cj6VtYpBI4

source: http://www10.giscafe.com/nbc/articles/view_article.php?section=CorpNews&articleid=804303
Monday, March 8, 2010

Friday, February 26, 2010

Monday, February 22, 2010
iPhone Camera for a 3D Project
I like PhotoModeler, you can create in this program excellent 3D model with texture!
You can use only iPhone with fixed lens as a survey instrument, sounds great... :)
Here is a good example:
".....The photos were loaded into PhotoModeler Scanner, marked for key points and oriented (PhotoModeler figures out where the iPhone was at the time of each exposure). Then the DSM (dense surface modeling) algorithm was run on the photos to produce dense point clouds - like a laser scan would do but all correctly tied together...."
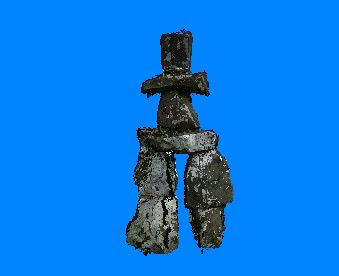
Source and more information: http://www.photomodeler.com/applications/other/iPhone_Inukshuk.htm
You can use only iPhone with fixed lens as a survey instrument, sounds great... :)
Here is a good example:
".....The photos were loaded into PhotoModeler Scanner, marked for key points and oriented (PhotoModeler figures out where the iPhone was at the time of each exposure). Then the DSM (dense surface modeling) algorithm was run on the photos to produce dense point clouds - like a laser scan would do but all correctly tied together...."

Source and more information: http://www.photomodeler.com/applications/other/iPhone_Inukshuk.htm
Thursday, February 18, 2010
LizardTech - LiDAR File Compression
“LiDAR Compressor compresses your LiDAR data to the industry standard MrSID format, trusted as a raster format by geospatial professionals since 1992 and supported in virtually all GIS applications. With the release of LiDAR Compressor LizardTech unveils a new and improved version of the format, MrSID Generation 4 (MG4). It's still LizardTech and it's still MrSID, so you know you're using the highest quality file format with the most advanced compression technology available. MG4 enables you to view and access your LiDAR data faster.”
LiDAR Compressor costs: 2995$
Source and more information: http://www.lizardtech.com/products/lidar/
Thursday, February 11, 2010
Augmented reality, a vision of the future
http://vimeo.com/8569187
Interesting to see here, that augmented reality is used for advertising (on a massive scale), and only a little bit of useful information.
But this is only a utopia. Maybe it will really be used to gather and visualize information about ancient buildings, and old churches in town..
Thursday, February 4, 2010
MakerBot - affordable, opne source 3D printer
The result of laser scanner documentation is mostly a digital 3D model. You can make physical replicas of the digital models with this open source 3D printer! Very good concept on this website!

Wednesday, February 3, 2010
The new Trimble CX scanner
The announcement was made at World of Concrete 2010.
This high-accuracy sensor captures more than 50,000 position points per second - enough data to record the details of a target's shape, size and position.

More Information: http://trl.trimble.com/docushare/dsweb/Get/Document-479635/022504-111_Trimble_CX_DS_1109_LR.pdf
Tuesday, February 2, 2010
Mapping Riparian Vegetation with Lidar Data
Combining GIS and lidar data enabled predictive mapping for riparian areas for a portion of the Sierra Nevada mountain range. Riparian areas pose many problems for vegetation modeling because of their narrow width, dendritic pattern, and the sensitivity of plant species to subtle changes in topography that cannot be easily recorded by coarse-scale digital elevation models (DEMs). Vegetation mapping and monitoring in riparian areas have relied heavily on field-based surveys that record the distribution of plant communities along transects perpendicular to the river. Typically, these studies also collect ancillary variables, such as stage elevation or height above the river (HAR), soil texture, and soil moisture, that are used to predict the distribution of vegetation types. However, these methods are extremely time consuming and do not allow for the development of predictive maps because the data collected cannot easily be extrapolated to a larger region. GIS and lidar data provide an opportunity to derive variables, such as HAR, for large areas, making wall-to-wall predictive mapping a possibility.“
Interesting paper, authors: By Thomas E. Dilts, Jian Yang, and Peter J. Weisberg, University of Nevada, Reno
ArcGIS Spatial Analyst extension was used, good example to create a model with ArcGIS from LiDAR dataset.
Link: http://www.esri.com/news/arcuser/0110/files/mapping-with-lidar.pdf
Thursday, January 28, 2010
USS Missouri Point Cloud Animation
"Point cloud animation of the USS Missouri (BB-63). The entire external hull of the ship was documented in January 2010 while in dry-dock by team headed by Smart GeoMetrics..."

link: http://www.youtube.com/watch?v=zPtT4LXwMBs&feature=player_embedded

link: http://www.youtube.com/watch?v=zPtT4LXwMBs&feature=player_embedded
Friday, January 22, 2010
LizardTech Releases MG4 Decode Tool
Nice program!
“Our goal is to create easy-to-use, efficient tools for geospatial professionals,”
said Jon Skiffington, LizardTech’s director of marketing. “With the release of MG4 Decode, users will be able to use a simple graphical interface to turn their compressed MrSID LiDAR files back to LAS or text format.”
Free download:
“Our goal is to create easy-to-use, efficient tools for geospatial professionals,”
said Jon Skiffington, LizardTech’s director of marketing. “With the release of MG4 Decode, users will be able to use a simple graphical interface to turn their compressed MrSID LiDAR files back to LAS or text format.”
Free download:
http://www.lizardtech.com/download/dl_options.php?page=tools
Thursday, January 21, 2010
The Landsat Image Mosaic of Antarctica
"The Landsat Image Mosaic of Antarctica (LIMA) is the first true-color, high-spatial-resolution image of the seventh continent. It is constructed from nearly 1100 individually selected Landsat-7 ETM+ scenes. Each image was orthorectified and adjusted for geometric, sensor and illumination variations to a standardized, almost seamless surface reflectance product. Mosaicing to avoid clouds produced a high quality, nearly cloud-free benchmark data set of Antarctica for the International Polar Year from images collected primarily during 1999–2003...."
I like movies, one of my favorite is “The Thing” in the sci-fi/horror category. The story plays on an Antarctic research station. The man can feel on this place the weakness, it is impossible to get help. If I could choose between ice and desert, like extreme places on the earth, I would like to travel to Antarctica. Darkness and nothing (wintertime)…. It is peaceful!
link:
Friday, January 15, 2010
Integration of regional to outcrop digital data: 3D visualisation
A very interesting paper....
"Abstract
Multi-scale geological models contain three-dimensional, spatially referenced data, typically spanning at least six orders of magnitude from outcrop to regional scale. A large number of different geological and geophysical data sources can be combined into a single model. Established 3D visualisation methods that are widely used in hydrocarbon exploration and production for sub-surface data have been adapted for onshore surface geology through a combination of methods for digital data acquisition, 3D visualisation, and geospatial analysis. The integration of georeferenced data across a wider than normal range in scale helps to address several of the existing limitations that are inherent in traditional methods of map production and publishing. The primary advantage of a multi-scale approach is that spatial precision and dimensionality (which are generally degraded when data are displayed in 2D at a single scale) can be preserved at all scales. Real-time, immersive, interactive software, based on a ‘‘3D geospatial’’ graphical user interface (GUI), allows complex geological architectures to be depicted, and is more inherently intuitive than software based on a standard ‘‘desktop’’ GUI metaphor. The continuing convergence of different kinds of geo-modelling, GIS, and visualisation software, as well as industry acceptance of standardised middleware, has helped to make multi-scale geological models a practical reality. Thisis illustrated with two case studies from NE England and NW Scotland."
More on this website:
http://www.dur.ac.uk/r.r.jones/Downloads/C&G2008_Jones_etal_Vis_Multi-scale_Models.pdf
Thursday, January 14, 2010
Global Mapper and Basic Visualization of GEON LiDAR Workflow Products
I like Global Mapper, cheap GIS program. You can create orthophotos in this program. The fine visualization of LIDAR datasets is possible, as well. Here is a link, a tutorial, how does it work…..
http://cws.unavco.org:8080/cws/learn/uscs/2008/2008Lidar/handouts/Global_Mapper_and_GLW.pdf
Saturday, December 5, 2009
Free vector and raster map data
Again, some free geodata:
http://www.naturalearthdata.com/That big, green 'Get the data' button is funny. :)
Anyway, the design of the page is clear, so it fits in.
(The problem with these datasets is, that you cannot use them in a commercial way.
Not because of the legal issues, but because every project I know of needs way more detailed maps, for a small area.
These can be great for educational purposes, maybe for research (climate, weather, ecology?), but not for building construction, highway planning, navigation, etc.)
Thursday, December 3, 2009
Climate Data Sources
"This page is a catalogue that will be kept up to date pointing to selected sources of code and data related to climate science. Please keep us informed of any things we might have missed, or any updates to the links that are needed:"
(Another interesting link from the world of climate research, for those who have a lot of time:
Tuesday, November 24, 2009
Seattle Conference on Scalability: MapReduce Used on Large Data Sets
Google Tech Talks June 23, 2007 ABSTRACT 2007 Google Seattle Conference on Scalability:
"Using MapReduce on Large Geographic Datasets Speaker: Barry Brumitt, Google, Inc. MapReduce is a programming model and library designed to simplify distributed processing of huge datasets on large clusters of computers. This is achieved by providing a general mechanism which largely relieves the programmer from having to handle challenging distributed computing problems such as data distribution, process coordination, fault tolerance, and scaling. While working on Google maps, I've used MapReduce extensively to process and transform datasets which describe the earth's geography. In this talk, I'll introduce MapReduce, demonstrating its broad applicability through example problems ranging from basic data transformation to complex graph processing, all the in the context of geographic data."
Video here:
Sunday, November 22, 2009
Full-waveform ALS workshop - Exercise C - Classification and filtering of full-waveform ALS data
Third exercise. Last step of this workflow: Classification and filtering. Here we learned some interesting things about OPALS and SCOP++ software's. First time, when I used SCOP++, but I think, it is an useful software to create DTM's....
Classification and filtering of full-waveform ALS data from Gottfried Mandlburger.
"Program:
Perform the following tasks with one of the prepared datasets:
1) Digital Surface Model (DSM) using OPALS
a) Import first echoes of FWF dataset (project_first_echo.xyz ) into the OPALS Data Manager (opalsImport)
b) Calculate a Digital Surface Model (opalsGrid) and quality models (sigma, excentricity)
c) Visualize the resulting DSM as hill shading (opalsShade) and color coded raster map (opalsZColor)
d) Visualize the sigma and excentricity model (opalsZColor) and compare and interpret the results visually with respect to the hill shading
2) Analysis of Full Waveform (FWF) Attributes:
a) Import last echoes of FWF dataset (project_last_echo.xyz ) into the OPALS Data Manager (opalsImport)
b) Perform raster analysis of FWF attributes (opalsCell):
• Amplitude
• Echo width
c) Derive color coded visualizations of the attribute/echo width raster (opalsZColor)
d) Compare and interpret the results visually with respect to the hill shading
3) Perform a standard DTM filtering / classification of the point cloud
a) Derive a Digital Terrain Model based on the last echoes (project_last_echo.xyz) using SCOP++ (Robust Interpolation, strategy :Lidar DTM Default)
b) Visualize the DTM (hill shading, Z-Coding, Isolines …)
4) Filtering of the point cloud with pre-classification on echo width basis
a) Repeat the steps 3a and 3b for the last echoes with small echo widths (ew<1.9ns (project_last_echo_small_ew.xyz)
b) Compare and interpret the results visually with respect to the results of Step 3 by means of the hill shading
5) Extra task: Difference model
a) Derive a normalized Surface Model: nDSM = DSM-DTM (opalsDiff)
b) Visualize the nDSM (opalsZColor)"
Classification and filtering of full-waveform ALS data from Gottfried Mandlburger.
"Program:
Perform the following tasks with one of the prepared datasets:
1) Digital Surface Model (DSM) using OPALS
a) Import first echoes of FWF dataset (project_first_echo.xyz ) into the OPALS Data Manager (opalsImport)
b) Calculate a Digital Surface Model (opalsGrid) and quality models (sigma, excentricity)
c) Visualize the resulting DSM as hill shading (opalsShade) and color coded raster map (opalsZColor)
d) Visualize the sigma and excentricity model (opalsZColor) and compare and interpret the results visually with respect to the hill shading
2) Analysis of Full Waveform (FWF) Attributes:
a) Import last echoes of FWF dataset (project_last_echo.xyz ) into the OPALS Data Manager (opalsImport)
b) Perform raster analysis of FWF attributes (opalsCell):
• Amplitude
• Echo width
c) Derive color coded visualizations of the attribute/echo width raster (opalsZColor)
d) Compare and interpret the results visually with respect to the hill shading
3) Perform a standard DTM filtering / classification of the point cloud
a) Derive a Digital Terrain Model based on the last echoes (project_last_echo.xyz) using SCOP++ (Robust Interpolation, strategy :Lidar DTM Default)
b) Visualize the DTM (hill shading, Z-Coding, Isolines …)
4) Filtering of the point cloud with pre-classification on echo width basis
a) Repeat the steps 3a and 3b for the last echoes with small echo widths (ew<1.9ns (project_last_echo_small_ew.xyz)
b) Compare and interpret the results visually with respect to the results of Step 3 by means of the hill shading
5) Extra task: Difference model
a) Derive a normalized Surface Model: nDSM = DSM-DTM (opalsDiff)
b) Visualize the nDSM (opalsZColor)"
Subscribe to:
Posts (Atom)