Thursday, December 31, 2009
Monday, December 21, 2009
For Xmas, we give you: The Known Universe!
http://www.amnh.org/news/2009/12/the-known-universe/
Nice video from AMNH.
After the animation left our universe, it stopped playing, but it was only loading, so don't you worry: the "out there" is out there.. :)
It was an obvious choice to start this journey from Tibet.
Saturday, December 12, 2009
Saturday, December 5, 2009
Free vector and raster map data
Again, some free geodata:
http://www.naturalearthdata.com/That big, green 'Get the data' button is funny. :)
Anyway, the design of the page is clear, so it fits in.
(The problem with these datasets is, that you cannot use them in a commercial way.
Not because of the legal issues, but because every project I know of needs way more detailed maps, for a small area.
These can be great for educational purposes, maybe for research (climate, weather, ecology?), but not for building construction, highway planning, navigation, etc.)
Thursday, December 3, 2009
Climate Data Sources
"This page is a catalogue that will be kept up to date pointing to selected sources of code and data related to climate science. Please keep us informed of any things we might have missed, or any updates to the links that are needed:"
(Another interesting link from the world of climate research, for those who have a lot of time:
Wednesday, November 25, 2009
New background image for the header
This weekend I spared some time to finally play with the background image of the header.
The algorithm was this: I put random rectangles on the terrain (increasing the height of its points by 1) until somewhere the height reached 255. (The result was more satisfying than I first thought.)
After this I tried to create the lines.
The first try was a simple modulo, if the height at a given point is the multiple for instance 25, there will be a gray point on the map. This is the result:

As you can see, it's like a galaxy.. not a map. The lines are not really connected. The shape can be seen, but still...
So, the next approach was: check the neighbours, and if there is a difference in height by modulo 25, we'll draw a gray point.
Result:

Much better! But the lines are too thick.. an edge detection will solve the problem: you'll only check a certain point, and only one of its neighbours: the uppermost.
Result:

And the final version, which we are using now as a background:

It makes the small text quite unreadable, but at least we have something like a map. I'll play some more with this, maybe I'll use only an image, putting on it red or blue text, so it will be more readable.
Tuesday, November 24, 2009
GeoServer, GeoTools and GeoBatch: supporting operational Meteorology and Oceanography
Found this one today, I don't have the time now, so I cannot tell whether it's worth watching or not:
http://blip.tv/file/2799458
Seattle Conference on Scalability: MapReduce Used on Large Data Sets
Google Tech Talks June 23, 2007 ABSTRACT 2007 Google Seattle Conference on Scalability:
"Using MapReduce on Large Geographic Datasets Speaker: Barry Brumitt, Google, Inc. MapReduce is a programming model and library designed to simplify distributed processing of huge datasets on large clusters of computers. This is achieved by providing a general mechanism which largely relieves the programmer from having to handle challenging distributed computing problems such as data distribution, process coordination, fault tolerance, and scaling. While working on Google maps, I've used MapReduce extensively to process and transform datasets which describe the earth's geography. In this talk, I'll introduce MapReduce, demonstrating its broad applicability through example problems ranging from basic data transformation to complex graph processing, all the in the context of geographic data."
Video here:
Sunday, November 22, 2009
Full-waveform ALS workshop - Exercise C - Classification and filtering of full-waveform ALS data
Third exercise. Last step of this workflow: Classification and filtering. Here we learned some interesting things about OPALS and SCOP++ software's. First time, when I used SCOP++, but I think, it is an useful software to create DTM's....
Classification and filtering of full-waveform ALS data from Gottfried Mandlburger.
"Program:
Perform the following tasks with one of the prepared datasets:
1) Digital Surface Model (DSM) using OPALS
a) Import first echoes of FWF dataset (project_first_echo.xyz ) into the OPALS Data Manager (opalsImport)
b) Calculate a Digital Surface Model (opalsGrid) and quality models (sigma, excentricity)
c) Visualize the resulting DSM as hill shading (opalsShade) and color coded raster map (opalsZColor)
d) Visualize the sigma and excentricity model (opalsZColor) and compare and interpret the results visually with respect to the hill shading
2) Analysis of Full Waveform (FWF) Attributes:
a) Import last echoes of FWF dataset (project_last_echo.xyz ) into the OPALS Data Manager (opalsImport)
b) Perform raster analysis of FWF attributes (opalsCell):
• Amplitude
• Echo width
c) Derive color coded visualizations of the attribute/echo width raster (opalsZColor)
d) Compare and interpret the results visually with respect to the hill shading
3) Perform a standard DTM filtering / classification of the point cloud
a) Derive a Digital Terrain Model based on the last echoes (project_last_echo.xyz) using SCOP++ (Robust Interpolation, strategy :Lidar DTM Default)
b) Visualize the DTM (hill shading, Z-Coding, Isolines …)
4) Filtering of the point cloud with pre-classification on echo width basis
a) Repeat the steps 3a and 3b for the last echoes with small echo widths (ew<1.9ns (project_last_echo_small_ew.xyz)
b) Compare and interpret the results visually with respect to the results of Step 3 by means of the hill shading
5) Extra task: Difference model
a) Derive a normalized Surface Model: nDSM = DSM-DTM (opalsDiff)
b) Visualize the nDSM (opalsZColor)"
Full-waveform ALS workshop - Exercise B - Quality control and georeferencing
Quality control and georeferencing are the next steps in the workflow.
Second exercise - Quality control and georeferencing from Camillo Ressl
"Geometric accuracy – motivation
• Accurate georeferencing isr equired for properly using the ALS data:
- 2 components: absolute georeferencing & relative georeferencing
Absolute georeferencing of the data (checking it always requires some sort of external ground control data)
Relative georeferencing: describes the orientation of the ALS strips with respect to each other. How well do the strips fit together? Check of consistency and accuracy, compute difference between neighbouring ALS-strips."
We learned here, how can we check the georeferencing..... I write later more about this theme!

Full-waveform ALS workshop - Exercise A - Waveform Analysis
The exercises were the best part of the workshop. I think, the work in small groups (eight people) was very beneficial.

First Exercise: Waveform Analysis from Thomas Melzer and Andreas Roncat
"In this exercise, full-waveform analysis is demonstrated with a sample data
set of the 2005 ight mission over the Schonbrunn area, Vienna. In the rst
section of the exercise, single waveforms will be analysed, the second part focuses
on the overall processing of this sample data set."
Second part. Work with OPALS.
Exercise A-2: Fullwave Analysis Using Opals from Thomas Melzer
"This exercise illustrates how to use OPALS to
- perform fullwave analysis on the output of a RIEGL LMSQ-560 scanner (SDF format)
- transform the resulting point cloud from the scanner system into project coordinates, e.g. UTM ("weak" georeferencing)."
I wolud like to give some information about OPALS:
"OPALS stands for Orientation and Processing of Airborne Laser Scanning data. It is a modular program system consisting of small, well defined components referred to as ’modules’. Each module is accessible in three different ways:
• as commandline executable from within a DOS/unix shell
• as Python module from within a Python shell
• as C++ class via DLL linkage
Modern ALS sensors provide a huge amount of data (several Mio. points per km²). Thus, efficient management of point cloud data is a precondition for sucessful processing of ALS projects. Within OPALS, the administration of point and line related geometries is based on the OPALS Data Manager (ODM). The ODM acts as a spatial cache and features:
• high performance spatial queries (nearest neighbour and range queries) using two different spatial indices (K-d-tree for points and R*-tree for all other objects)
• an extensible adminstration scheme for storing arbitrary attributes (additional infos like (eg. echo width, echo number, amplitude, classification, surface normal vector, etc.) on a per point basis." (source: OPALS_gettingStarted.pdf)
more here: http://www.ipf.tuwien.ac.at/opals/opals_docu/index.php
I think, in the future we will hear more about this excellent software research....
Friday, November 20, 2009
Michael Jackson's 3D Body Scans on eBay for $1.5 Million
That was a great idea in 1996. However, I am astonished by it since 3d scanners were not too wide spread in the 1990's.
Link: http://gizmodo.com/5407507/michael-jacksons-3d-body-scans-on-ebay-for-15-million

Wishful thinking; Imagine there is a company to scan recent singers and other stars for movies and production in the future.
Link: http://gizmodo.com/5407507/michael-jacksons-3d-body-scans-on-ebay-for-15-million

Wishful thinking; Imagine there is a company to scan recent singers and other stars for movies and production in the future.
Thursday, November 19, 2009

Wednesday, November 18, 2009
Full-waveform ALS workshop - Experience with operational FWF ALS - Projects in Archaeology
Ninth Presentation
Michael Doneus: Experience with operational FWF ALS - Projects in Archaeology
CONTENTS:
- Archaeological background –Aerial Archaeology
- ALS andVegetation
- Technical Issues
o Types of Scanning Systems
o Filtering
o Georeferencing
o Acquisition -Time Frame
- Archaeological Issues
o Interpretation
o ComparisonwithTerrestrial Survey
o ALS andArchaeological Prospection
- ArchaeologicalApplications
CONCLUSION:
Only if we understand the technology, issues and limitations coming with data collection, filtering and interpretation we will be able to successfully apply ALS within various disciplines.

Full-waveform ALS workshop - Breaklines and DTM filtering with FWF ALS
Eighth Presentation
Christian Briese: Breaklines and DTM filtering with FWF ALS
Overview:
• Motivation
• Structure line extraction
- Automated structure line modelling
- Automatic start segments
• DTM generation
- Standard methods
- Improvement by full-waveform (FWF) ALS
• FWF attributes
• FWF data management
• Improved DTM generation based on an echo width threshold
• Extended robust interpolation by individual a priori weights determined from FWF
attributes

Summary:
Improved DTM determination with FWF ALS
• Additional Information available by FWF ALS data
Per echo: distance, amplitude, echo width, cross-section
• Interesting results in order to detect last echoes reflected by low vegetation
• Further studies are still necessary:
- Analysis of the influence of the footprint size, the incidence angle, …
- Analysis of the accuracy and reliability of the FWF attributes (distance, echo
width, amplitude, …)
- Comparison of different sensors
• Extension of the Filtering and Classification Methods
- additionally to the typically purely geometric criteria – additional FWF echo
attributes are available and should be integrated into the classification process
- however, a large area based detailed analysis of the advantages of the FWF
attributes is necessary in the future
Full-waveform ALS workshop - Signature analysis of full-waveform ALS data
Seventh Presentation
Werner Mücke, Wolfgang Wagner: Signature analysis of full-waveform ALS data
Overview:
- Brief revision
- Additional full-waveform (FWF) parameters (directly observed or derived)
- Interaction of the laserbeam with the surface
- Effect of different surface types on the FWF observables
- Scale / typical values of FWF observables
- How can FWF observables be used operationally?
- Examples
- Usage of FWF observables (e.g. point cloud classification, vegetation
detection, tree-species identification, structural information, ...)

Summary:
- Introduction to FWF ALS data
- Further understanding of interaction of the laser beam with different
surface types
- How can FWF ALS measures be used operationally?
- Examples for
Tree species classification
Retrieval of structural information
Point cloud classification
Full-waveform ALS workshop - Georeferencing of ALS Data
Sixth Presentation
Norbert Pfeifer: Georeferencing of ALS Data
Overview:
• Multi Sensor System
• Errors
- Data driven point of view
- Components of the system
• Mathematical models for correction
- Model driven approaches
- Approaches not considering the measurement process
• Observation of discrepancies
• Examples
• Summary / Points of further discussion

Summary:
• Elevation- and planimetric-coordinates of the “original” points on the ground and upon objects are
affected by systematic errors caused by the GPS/INS/Laser scanner system. This leads to
erroneous georeferencing. (direct georeferencing)
• Errors may be static or dynamic and global or varying from strip to strip.
• First quality check: Computation of differences in the strip overlap
• Elevation in height alone is not sufficient
• 3D correction of exterior and interior orientation (calibration) is necessary
• Solution: ALS strip adjustment with rigorous mapping function (polar measurement and trajectory from
GPS/INS with tie patch parameters)
- Minimization of errors at autoamtically determined homologous objects (planes)
- Quality parameters (improvement of std.dev. After adjustment)
• For high precision demands (relative and absolute accuracy) ground control is required.
• Flight planning must consider cross strips and control point areas.
• Quality control is a must for each block! Graphic display of the discrepancies is a thorought check for
detecting systematic errors (excluding the datum).
• Future aims: Standardization in ALS
- GPS/IMU preprocessing
- Fligh parameters: strip overlap, flight patterns (cross strips)
- Quality of ALS data should be estimatable a priori (as for image-based AT)
Full-waveform ALS workshop - Radiometric Calibration of Full-Waveform Small-Footprint Airborne Laser Scanner Data
Fifth Presentation
Christian Briese, Hubert Lehner: Radiometric Calibration of Full-Waveform Small-Footprint Airborne Laser Scanner Data

Conclusions:
• Radiometric calibration essential for adequate use of full-waveform ALS
sensors
• Practical methods have become available
• Further R&D
- Radiometric accuracy (in %)
- Internal calibration (monitoring of sensor functions)
- Deviations from radar equation
- Object signatures at 1 μm, 1.5 μm and other ALS frequencies
Full-waveform ALS workshop - Waveform Analysis
Fourth Presentation
Andreas Roncat, Thomas Melzer: Waveform Analysis
Scattering Cross-Section:
• A single scatterer is characterized by its differential scattering crosssection,
σ(t) which depends on its
- size
- reflectivity
- roughness
- directionality and solid angle of reflectance (BRDF)
• The measured echo (return signal) due to a scatterer depends also on the
- incidence angle between emitter/scanner and surface
- original strength of the emitted pulse
- attenuation of the pulse due to distance (R-square-law) and occlusion

Full-waveform ALS workshop - OPALS
Third Presentation
Gottfried Mandlburger, Johannes Otepka, Wilfried Karel: OPALS Software – Orientation and Processing of Airborne Laser Scanning data
new software concept, very great research!!!

Software Concept:
• Modular structure composed of small, well defined units (modules)
• Availability of modules as:
- Command line programs
- Python modules
- C++ classes via DLL linkage
• Individual process control via scripts
- Shell scripts (Unix/Linux), Batch (MS Win2000/XP/Vista)
- Python
• Management of point cloud data based on the OPALS Data Manager (ODM)
• Interfaces for efficient data interchange with DTM-, CAD-,GIS- and
Visualisation/Modelling-Software
- SCOP++, …
- AutoCAD, MicroStation, …
- ArcGIS, Grass-GIS, Quantum-GIS, …
- 3D-Studio, GeoMagic, Deep Exploration, SMS (Surface Modelling System)
• Use of standard and open-source libraries (boost, GDAL/OGR, CGAL, ...)
• Abdication of interactivity
Full-waveform ALS workshop - Principle of Full- and Online Waveform Analysis in Airborne, Mobile and Terrestrial Laser Scanning
Second presentation was from Riegl Company. I already wrote about Riegl VZ-400 scanner, here we heard some Online Waveform Analysis applications....
Dr. Andreas Ullrich, DI Peter Rieger: Principle of Full- and Online Waveform Analysis in Airborne, Mobile and Terrestrial Laser Scanning
Overview:
- Introduction
- Laser Scanner RIEGL LMS-Q680 for Full Waveform Analysis
- Full Waveform Analysis and Online Waveform Processing
- Full Waveform Sample Data
- Multiple Time Around Technique
- RIEGL V-Line Laser Scanners with Online Wavefrom Processing
- Calibrated Reflectance
- Multi Target Capability
- Online Waveform Sample Data


Full-waveform ALS workshop - Measurement Principle and Physical Fundamentals
First presentation
Wolfgang Wagner: Measurement Principle and Physical Fundamentals
Overview:
• How does a full-waveform laser scanner work?
• Important properties of laser light
• Range determination and range resolution
• Beam pattern and spatial resolution
• Radar equation
• Cross section of different targets
• Waveform generation
• Waveform analysis → Presentation of Andreas Roncat
• Radiometric calibration → Presentation of Christian Briese
Conclusions:
• Full-waveform laser scanners depict the measurement process in its
entire complexity
- Full-waveform system are compatible with ranging systems, but not vice-versa
• Advantages
- Algorithms can be adjusted to tasks
- More echoes as in first/last pulse systems
- Intermediate results are respected
- Neighbourhood relations can be taken into account
• Calibration of the data, i.e. conversion to cross section, is essential for
physical modelling efforts
• The additional data, i.e. amplitude, width, cross section, is valuable for
segmentation and classification purposes
- Classifying terrain and non-terrain points for DTM filtering

Full-waveform ALS workshop successfully completed
Hallo everybody,
Thank you, workshop was great, good organized. DTM generation is a big topic!!! I learned some new information about full-waveform....we see here a picture from Vienna...

Thank you, workshop was great, good organized. DTM generation is a big topic!!! I learned some new information about full-waveform....we see here a picture from Vienna...

Saturday, November 7, 2009
14. International Congress "Cultural Heritage and New Technologies" - Vienna
TerraFormatics will be there! You will find some fresh news on our blog!

Workshop 14 will be held
from November 16th to November 18th 2009 in Vienna, CITY HALL (Rathaus der Stadt Wien)
MAIN TOPIC 2009:
ARCHIVING - or building an information system
Archiving is today central to nearly all aspects of Cultural Heritage Management.
Archives (Archaeological excavations, libraries, documents, data collections,...) are important data repositories.
The data contained in correctly treated and accessible archives makes wide and varied information available.
How can archiving in all its aspects best promote knowledge about and support the protection and conservation of cultural heritage?
Link:
Digital Terrain Models from Full Waveform Laser Scanning Workshop
TerraFormatics will post some information about this workshop!
organizers:
Univ.Prof. Wolfgang Wagner
Univ.Prof. Norbert Pfeifer
Institute of Photogrammetry and Remote Sensing
Christian Doppler Laboratory for Spatial Data from Laser Scanning and Remote Sensing
Vienna University of Technology
___________________________________________________________________________
Date: November 12 - 13, 2009
Venue: Vienna University of Technology-Gusshausstrasse 27-29-1040 Wien-Austria
___________________________________________________________________________

Motivation
Airborne laser scanning is a technology which has developed rapidly in the last few years. It has set new standards, especially for the generation of digital terrain models (DTM). A great advantage of laser scanning is the ability to “see” through gaps in the vegetation foliage. The DTM quality strongly depends on the correct classification of the 3D point cloud into terrain and off-terrain echoes. Especially dense and low vegetation is considered as problematic. With full waveform laser scanners, commercially available since 2004, a considerable amount of these problems can be overcome. Additionally, new quality indicators can be derived.
Goals
This workshop will teach the basics of full waveform laser scanning in lectures, exercises, and discussions. It will reach from the sensor specifications to terrain modeling. The following list of topics will be treated.
* Measurement principle and physical foundations
* Sensor properties and measurement process
* Waveform analysis and calibration
* Geo-referencing
* Signature analysis of full waveform parameters
* Classification and segmentation
* Filtering (classification) based on full-waveform information
* DTM derivation
* Quality control
Three practical exercises will be carried out, next to a demonstration of a full waveform sensor. Each participant will follow each exercise in groups – with a maximum of ten persons per group.
Wednesday, November 4, 2009
digital 210 king
A very good blog about Building Information Modeling (BIM) with Autodesk applications.

http://www.digital210king.org/blog.php?p=5&elq=nl

http://www.digital210king.org/blog.php?p=5&elq=nl
Shazam
Something similar is going on with feature extraction of scanned data. This is just audio:
(In laser scanning this technique is used to map point clouds - taken from different angle - together.)
DuckDuckGo
http://duckduckgo.com/?q=laser+scanning&v=d
A new search engine: with 'zero click', you'll get results about the searched topic, so you can avoid clicking the results until you find some useful information.
Pretty impressive.
Tuesday, November 3, 2009
Saturday, October 31, 2009
AWK dictionary, second version
A newer version of the 'awk dictionary' program: you can store string pairs, and ask for any of them. The program will give you back its pair. (In this version it does not matter, that the questioned string is the first or second one of the pair.)
A sample output:
BEGIN {
 ARGC = 2; ARGV[1] = "-"
 do {
     printf("prompt>")
     while ((input = getline) > 0)
         if ($0 ~ "exit") {
             print "Exit!"
             input = 0;
             break
         } else if(NF > 1)
         {
             a[$1] = $2;
             b[$2] = $1;
             break
         } else if(NF == 1)
         {
             printf $1 " ";
             print a[$1] b[$1];
             break
         }
 } while (input > 0)
}
D:\Awk>awk talk
prompt>He Helium
prompt>Ne Neon
prompt>He
He Helium
prompt>Neon
Neon Ne
prompt>exit
Exit!
Thursday, October 29, 2009
Indigo
http://opensource.scitouch.net/indigo/
Not geology-related, the above link directs to a chemical open-source toolkit. I'm wondering if there exists something similar to geography as well.
Not geology-related, the above link directs to a chemical open-source toolkit. I'm wondering if there exists something similar to geography as well.
International Space Station animation
 http://i.usatoday.net/tech/graphics/iss_timeline/flash.htm
I didn't know, that some parts were moved from one place to another while building.
Tuesday, October 27, 2009
Pi with awk
The other day I needed to find a good rational estimation for pi - don't ask why.
Awk was at hand, and with this few lines I found, what I forgot: 22/7, and 355/113 are the most 'famous' estimations for pi. The next - more precise - approximation is 52.163/16.604, which is not that 'nice.'
Here are the lines:
BEGIN{
 x = 3;
 y = 1;
 pi  = 3.1415926535897932384626433832795;
 diff = 1;
 searchfor = pi;

 for(f = 0; f < 100000; f++){
     if(x / y < searchfor){x = x + 1;}else{y = y + 1;}
     diffnew = abs(searchfor - x / y);
     if(diffnew < diff){
           printf ("%d/%d=%10.20f\n",x,y, x/y);
           diff = diffnew;
     }
 }
}

function abs(number){
 if(number < 0){return -number;}else{return number;}
}
Monday, October 26, 2009
Strange Maps
At this place you can find strange - sometimes funny, sometimes interesting - maps.
Worth checking...
The good thing with these maps is that they can easily give you some insight without having to read linear text.. you can learn visually, concentrate on the characteristics of the information.
So, they can provide some kind of small paradigm-shift without a lot of mindwork.
[Here is one (not fun, but interesting map) for those, who have read The Man In The High Castle (by Philip K. Dick): http://strangemaps.files.wordpress.com/2007/10/uusieurooppa.png ]
Saturday, October 17, 2009
Bad memories written with lasers
"Researchers have devised a way to write memories onto the brains of flies, revealing which brain cells are involved in making bad memories."......uhhh that shocked me....clean memories......
I am not fly, that is a good point :)

http://news.bbc.co.uk/2/hi/science/nature/8310365.stm
I am not fly, that is a good point :)

http://news.bbc.co.uk/2/hi/science/nature/8310365.stm
2008 AFE ANALYST OF THE YEAR
Save cost and save time with feature analyst! A very good ArcGIS extension.

http://www.featureanalyst.com/feature_analyst/publications/success/sansouci.ppt

http://www.featureanalyst.com/feature_analyst/publications/success/sansouci.ppt
Using Feature Analyst to Automate Counts of Photographed Indiana Bats
I like batman, one of my favorite heroes.... :) More about bat survey.....

Abstract:
"The Indiana bat (Myotis sodalis) is a Federally listed endangered species found in the Midwest and eastern United States. Its population has profound implications for forest management throughout its range. Declining populations could lead to timber harvest restrictions and changes to other land management practices in Midwestern and eastern forests. The Forest Plan and Biological Opinion of the Hoosier National Forest (Indiana) require hibernacula (i.e., winter hibernation sites) occupied by the Indiana bat to be monitored regularly to assess changes in population numbers. State and U.S. Fish and Wildlife Service biologists survey the bats every other winter while the bats are hibernating. Because management decisions and recovery action priorities are based on the population estimates and trends determined from these surveys, it is critical that they are accurate. During the surveys, individual bats and small clusters are counted directly, but those in larger clusters are estimated by multiplying the approximate area of the cluster by an assumed bat packing density. Unfortunately, estimates derived by these techniques can be highly inaccurate. In many hibernacula, using a digital camera to document bat numbers could reduce stress to the bats and also increase the accuracy of the population estimate by allowing the bats to be counted manually on a computer screen in an office setting. Nevertheless, this is a very tedious and labor-intensive task that some state and federal agencies cannot afford. An accurate, rapid, and more cost-effective way to count photographed bats is needed. With sponsorship from the U.S. Department of Agriculture, Forest Service Remote Sensing Steering Committee, the Remote Sensing Applications Center conducted a study to investigate the feasibility of rapidly deriving accurate counts of photographed bats using Feature Analyst, an extension for ArcGIS. Counts derived with Feature Analyst were typically within one to nine percent of manually interpreted counts and processing times of less than four minutes per photo were achieved. This represents a significant improvement over traditional in-cave estimates and has the potential for high-volume use, which could further reduce the per photo processing time."
http://www.featureanalyst.com/feature_analyst/publications/success/bats.pdf
Thursday, October 15, 2009
AWK dictionary
Another really simple awk program, just a mutation from the previous post. It works like a dictionary, if you put two words in it, it stores the pair. If you type only one word: it will search for a match.
BEGIN {
ARGC = 2; ARGV[1] = "-"
do {
printf("prompt>")
while ((input = getline) > 0)
if ($0 ~ "exit") {
print "Exit!"
input = 0;
break
} else if(NF > 1)
{
a[$1] = $2;
break
} else if(NF == 1)
{
print a[$1];
break
}
} while (input > 0)
}
A sample run is here:
prompt>He Helium
prompt>Ne Neon
prompt>He
Helium
prompt>Ne
Neon
AWK terminal, consol or shell
This is a small awk program, which makes you able to execute commands in a simple shell:
BEGIN {
ARGC = 2; ARGV[1] = "-"
do {
printf("prompt>")
while ((input = getline) > 0)
if ($0 ~ "exit") {
print "Exit!"
input = 0;
break
} else if ($0 ~ "help") {
print "commands: help, cmd1, cmd2, exit"
break
} else if ($0 ~ "cmd1") {
print "executing custom command 1"
break
} else if ($0 ~ "cmd2") {
print "executing custom command 2"
break
}else {
print "not understood"
break
}
} while (input > 0)
}
This is a sample run:
prompt>help
commands: help, cmd1, cmd2, exit
prompt>cmd1
executing custom command 1
prompt>blabla
not understood
prompt>exit
Exit!
It's nothing special, but it's a good start, if you want to use awk not from command line, but from within a more user-friendly shell.

Wednesday, October 14, 2009

Building maker from Google
 From now on, you can 'create' 3D models of buildings in Google Earth. Looks really nice, and I'm quite sure the community will model everything within reach. (Just like wikipedia, lots of users will contribute.)
Tuesday, October 13, 2009
Image recognition with java tool

Neuroph is an opensource tool collection for java, and as you can get from its name, it uses neural networks. In the future, we may use it in one of our sideprojects.
Here is an online demo:
You can get an overview here:
Of course the source code is available, and it's worth checking, if you're really into neural networks.
Monday, October 12, 2009

Tuesday, October 6, 2009
A New Way to 3D Scan Photo-based Scanning - Saves Time and Money
Paper by Alan Walford
I like it. Scanning with photos. :)
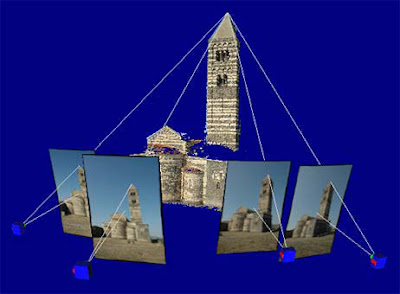
"Introduction
Do you need to create dense 3D point clouds and detailed surface models of physical objects, and do you want to do it in a cost-effective and efficient manner? A new class of 3D scanning technologies, called photo-based scanning, may be the solution you are looking for. This new technology uses a standard off-the-shelf digital camera in combination with specialized software that analyzes the digital images - there is no additional hardware required. The new technology is called photo-based scanning, or photogrammetric scanning. In this white paper we define 3D scanning, review the current methods for 3D scanning, introduce photo-based scanning, plus examine strengths and weaknesses of the various technologies."
"How Is Photo-Based Scanning Done?
These are typical steps for executing a 3D scan with a photo-based scanning system:
1. Ensure the object or scene has a suitable pattern or texture on the surface.
2. Ensure good and consistent lighting during photography.
3. If there are no suitable, easily-identifiable points around the scene or object, place some high contrast targets.
4. Take two or more photographs of the object or scene - these are often taken as pairs with the pair of photographs being close to parallel but separated horizontally.
5. Load the photographs into the photo-based scanning software.
6. In the software perform the orientation step - where the software, using the targets or sharp point markings, solves where the camera was during photography.
7. Initiate the software’s automated scanning/matching step on whole photos or selected sub-regions.
8. The resulting 3D point cloud can be filtered, meshed (to convert to a triangulated surface), or merged with other point clouds.
9. Export the result, perform measurements, or visualize with projected photo-textures.
"
Friday, October 2, 2009
Laser Center in Hungary
"We are supporting it, and giving the needed government guarantees." - said Gordon Bajnai on Saturday (2009.09.26) about ELI (Extreme Light Infrastructure), which may be built at Szeged, Hungary.
The same time, Hungarian government plans to increase R&D money by more than 5% next year.
"We cannot allow the crisis to live up our future." - said Bajnai, Hungaries prime minister.
The same time, Hungarian government plans to increase R&D money by more than 5% next year.
"We cannot allow the crisis to live up our future." - said Bajnai, Hungaries prime minister.
Radar Map of Buried Mars Layers
http://spacefellowship.com/2009/09/23/radar-map-of-buried-mars-layers-matches-climate-cycles/ Whats laser to Earth, is radar to Mars.
 Whats laser to Earth, is radar to Mars.
Thursday, October 1, 2009
GPS devices to monitor snowfall

A strange feeling is getting stronger and stronger in me: we are able to do anything, we already have the devices, it is only a question of creativity, manpower (engineers power of course), and time. We are just able to do anything.
Way back I read some news about earthquake detecting hard disks, and now this:
http://sciencenow.sciencemag.org/cgi/content/full/2009/929/2
Data sources
A few geographic datasources on the net worth checking:
http://www.openstreetmap.org/
http://www.census.gov/geo/www/tiger/
http://www.geocommons.com/
http://www.openstreetmap.org/
http://www.census.gov/geo/www/tiger/
http://www.geocommons.com/
Detailed photo of a 300 ft tall tree
 "...what the photographer ended up doing was building a custom rig containing 3 cameras, each one taking a slightly different shot: one to the left, one to the right, and one on the dead center. The rig was mounted to a gyroscope, and then the cameras took a series of pictures as the rig was lowered to the ground.
The end result: a vertical panorama comprised of 84 pictures, all stitched together to create one of the most complete pictures of a redwood tree we’ve ever seen."

Thursday, September 24, 2009
A LiDAR Odyssey in Earth Observation
ISPRS Laserscanning `09 invited talk is online.
from
Very interesting and enjoyable pdf about Earth`s atmospheric LiDAR research.
http://laserscanning2009.ign.fr/download/LS09_Invited_talk_PHF.pdf
from
"Pierre H. Flamant
Laboratoire de Météorologie Dynamique,
Institut Pierre Simon Laplace
École Polytechnique"

Very interesting and enjoyable pdf about Earth`s atmospheric LiDAR research.
http://laserscanning2009.ign.fr/download/LS09_Invited_talk_PHF.pdf
Tuesday, September 22, 2009
Private "laser shield"
I don`t believe it....that must be a very interesting system!

http://www.timesonline.co.uk/tol/news/world/europe/article6841380.ece

http://www.timesonline.co.uk/tol/news/world/europe/article6841380.ece
Saturday, September 19, 2009
Riegl VZ 400
Let me introduce the one of the best TLS system... I wrote already about this scanner. Last winter I met with Riegl VZ-400, you can control it with an iphone....amazing stuff...

"The new RIEGL VZ-400 3D Terrestrial Laser Scanner provides high speed, non-contact data acquisition using a narrow infrared laser beam and a fast scanning mechanism. High-accuracy laser ranging is based upon RIEGL’s unique echo digitization and online waveform analysis, which allows achieving superior measurement capability even under adverse atmospheric conditions and the evaluation of multiple target echoes. The line scanning mechanism is based upon a fast rotating multi-facet polygonal mirror, which provides fully linear, unidirectional and parallel scan lines. The RIEGL VZ-400 is a very compact and lightweight surveying instrument, mountable in any orientation and even under limited space conditions."
www.riegl.com/products/terrestrial-scanning/produktdetail/product/scanner/5/
www.riegl.com/uploads/tx_pxpriegldownloads/10_DataSheet_VZ400_10-09-2009.pdf
Full-Waveform filtering
Next generation scanners are integrated with full-waveform data acquisitions properties. Every single return pulse is documented. We can research the vertical conditions of the forest areas. Tree, bush, grass...different data class.

Interesting paper about full-waveform datasets....
INTEGRATION OF FULL-WAVEFORM INFORMATION INTO
THE AIRBORNE LASER SCANNING DATA FILTERING PROCESS
Y. -C. Lin and J. P. Mills
"ABSTRACT
Terrain classification of current discrete airborne laser scanning data requires filtering algorithms based on the spatial relationship between neighbouring three-dimensional points. However, difficulties commonly occur with low vegetation on steep slopes and when abrupt changes take place in the terrain. This paper reports on the integration of additional information from latest generation full-waveform data into a filtering algorithm in order to achieve improved digital terrain model (DTM) creation. Prior to a filtering procedure, each point was given an attribute based on pulse width information. A novel routine was then used to integrate pulse width information into the progressive densification filter developed by Axelsson. The performance was investigated in two areas that were found to be problematic when applying typical filtering algorithms. The derived DTM was found to be up to 0.7 m more accurate than the conventional filtering approach. Moreover, compared to typical filtering algorithms, dense low vegetation points could be removed more effectively. Overall, it is recommended that integrating waveform information can provide a solution for areas where typical filtering algorithms cannot perform well. Full-waveform systems are relatively cost-effective in terms of providing additional information without the need to fuse data from other sensors.
CONCLUSIONS
This study set out to investigate whether information derived from the latest generation full-waveform, small-footprint airborne laser scanning data could improve digital terrain modelling. A novel routine was designed to integrate waveform information into a commonly used filtering algorithm. The preliminary results have demonstrated that integrating pulse width information can provide a solution for areas where conventional filtering algorithms cannot perform well. On the top of an artificial mound, points rejected (Type I error) by a typical filtering algorithm can be correctly included in the developed routine. More low vegetation can also be correctly removed. However, rough or steep terrains with low vegetation cover, as well as forest terrain, still require further investigation and detailed validation. In addition, although identifying vegetation points becomes easier with the help of waveform information, it may be the case that in some densely vegetated areas insufficient “true” ground points exist for high-resolution DTM generation. In such cases, it might still be better to assume that the lowest point within a specified or adaptive window size is a ground point. The performance of existing filtering algorithms depends on the type of landscape (Sithole and Vosselman, 2004). Such approaches may require that users determine which type of landscape is being processed and then specify optimal parameters. As demonstrated in this paper, by using waveform information it is possible to automatically determine the landscape characteristics and then use the optimal parameter set for that specific landscape type. This will improve the automation of filtering procedures since less effort is required by users. Moreover, compared to ALS intensity values, pulse width information is easier to apply to different surveys since neither prior calibration or normalization procedures are required. Using full-waveform ALS data provides valuable physical and geometric information simultaneously. Such systems are relatively cost-effective in terms of providing multiple-information without the need to fuse data from other sensors."
Subscribe to:
Posts (Atom)