Saturday, October 31, 2009

AWK dictionary, second version

A newer version of the 'awk dictionary' program: you can store string pairs, and ask for any of them. The program will give you back its pair. (In this version it does not matter, that the questioned string is the first or second one of the pair.)


BEGIN {
ARGC = 2; ARGV[1] = "-"
do {
printf("prompt>")
while ((input = getline) > 0)
if ($0 ~ "exit") {
print "Exit!"
input = 0;
break
} else if(NF > 1)
{
a[$1] = $2;
b[$2] = $1;
break
} else if(NF == 1)
{
printf $1 " ";
print a[$1] b[$1];
break
}
} while (input > 0)
}


A sample output:
D:\Awk>awk talk
prompt>He Helium
prompt>Ne Neon
prompt>He
He Helium
prompt>Neon
Neon Ne
prompt>exit
Exit!

Thursday, October 29, 2009

Indigo

http://opensource.scitouch.net/indigo/
Not geology-related, the above link directs to a chemical open-source toolkit. I'm wondering if there exists something similar to geography as well.

International Space Station animation

http://i.usatoday.net/tech/graphics/iss_timeline/flash.htm
I didn't know, that some parts were moved from one place to another while building.

Tuesday, October 27, 2009

Pi with awk

The other day I needed to find a good rational estimation for pi - don't ask why.
Awk was at hand, and with this few lines I found, what I forgot: 22/7, and 355/113 are the most 'famous' estimations for pi. The next - more precise - approximation is 52.163/16.604, which is not that 'nice.'

Here are the lines:
BEGIN{
x = 3;
y = 1;
pi = 3.1415926535897932384626433832795;
diff = 1;
searchfor = pi;

for(f = 0; f < 100000; f++){
if(x / y < searchfor){x = x + 1;}else{y = y + 1;}
diffnew = abs(searchfor - x / y);
if(diffnew < diff){
printf ("%d/%d=%10.20f\n",x,y, x/y);
diff = diffnew;
}
}
}

function abs(number){
if(number < 0){return -number;}else{return number;}
}

Monday, October 26, 2009

Strange Maps

At this place you can find strange - sometimes funny, sometimes interesting - maps.
Worth checking...

The good thing with these maps is that they can easily give you some insight without having to read linear text.. you can learn visually, concentrate on the characteristics of the information.
So, they can provide some kind of small paradigm-shift without a lot of mindwork.

[Here is one (not fun, but interesting map) for those, who have read The Man In The High Castle (by Philip K. Dick): http://strangemaps.files.wordpress.com/2007/10/uusieurooppa.png ]

Saturday, October 17, 2009

Bad memories written with lasers

"Researchers have devised a way to write memories onto the brains of flies, revealing which brain cells are involved in making bad memories."......uhhh that shocked me....clean memories......
I am not fly, that is a good point :)


http://news.bbc.co.uk/2/hi/science/nature/8310365.stm

2008 AFE ANALYST OF THE YEAR

Save cost and save time with feature analyst! A very good ArcGIS extension.


http://www.featureanalyst.com/feature_analyst/publications/success/sansouci.ppt

Using Feature Analyst to Automate Counts of Photographed Indiana Bats

I like batman, one of my favorite heroes.... :) More about bat survey.....


Abstract:
"The Indiana bat (Myotis sodalis) is a Federally listed endangered species found in the Midwest and eastern United States. Its population has profound implications for forest management throughout its range. Declining populations could lead to timber harvest restrictions and changes to other land management practices in Midwestern and eastern forests. The Forest Plan and Biological Opinion of the Hoosier National Forest (Indiana) require hibernacula (i.e., winter hibernation sites) occupied by the Indiana bat to be monitored regularly to assess changes in population numbers. State and U.S. Fish and Wildlife Service biologists survey the bats every other winter while the bats are hibernating. Because management decisions and recovery action priorities are based on the population estimates and trends determined from these surveys, it is critical that they are accurate. During the surveys, individual bats and small clusters are counted directly, but those in larger clusters are estimated by multiplying the approximate area of the cluster by an assumed bat packing density. Unfortunately, estimates derived by these techniques can be highly inaccurate. In many hibernacula, using a digital camera to document bat numbers could reduce stress to the bats and also increase the accuracy of the population estimate by allowing the bats to be counted manually on a computer screen in an office setting. Nevertheless, this is a very tedious and labor-intensive task that some state and federal agencies cannot afford. An accurate, rapid, and more cost-effective way to count photographed bats is needed. With sponsorship from the U.S. Department of Agriculture, Forest Service Remote Sensing Steering Committee, the Remote Sensing Applications Center conducted a study to investigate the feasibility of rapidly deriving accurate counts of photographed bats using Feature Analyst, an extension for ArcGIS. Counts derived with Feature Analyst were typically within one to nine percent of manually interpreted counts and processing times of less than four minutes per photo were achieved. This represents a significant improvement over traditional in-cave estimates and has the potential for high-volume use, which could further reduce the per photo processing time."

http://www.featureanalyst.com/feature_analyst/publications/success/bats.pdf

Thursday, October 15, 2009

AWK dictionary

Another really simple awk program, just a mutation from the previous post. It works like a dictionary, if you put two words in it, it stores the pair. If you type only one word: it will search for a match.

BEGIN {
ARGC = 2; ARGV[1] = "-"
do {
printf("prompt>")
while ((input = getline) > 0)
if ($0 ~ "exit") {
print "Exit!"
input = 0;
break
} else if(NF > 1)
{
a[$1] = $2;
break
} else if(NF == 1)
{
print a[$1];
break
}
} while (input > 0)
}

A sample run is here:
prompt>He Helium
prompt>Ne Neon
prompt>He
Helium
prompt>Ne
Neon

AWK terminal, consol or shell

This is a small awk program, which makes you able to execute commands in a simple shell:

BEGIN {
ARGC = 2; ARGV[1] = "-"
do {
printf("prompt>")
while ((input = getline) > 0)
if ($0 ~ "exit") {
print "Exit!"
input = 0;
break
} else if ($0 ~ "help") {
print "commands: help, cmd1, cmd2, exit"
break
} else if ($0 ~ "cmd1") {
print "executing custom command 1"
break
} else if ($0 ~ "cmd2") {
print "executing custom command 2"
break
}else {
print "not understood"
break
}
} while (input > 0)
}


This is a sample run:
prompt>help
commands: help, cmd1, cmd2, exit
prompt>cmd1
executing custom command 1
prompt>blabla
not understood
prompt>exit
Exit!

It's nothing special, but it's a good start, if you want to use awk not from command line, but from within a more user-friendly shell.

3D fingerprinting


Wednesday, October 14, 2009

Missions

Get it, print it, enjoy:

Building maker from Google

From now on, you can 'create' 3D models of buildings in Google Earth. Looks really nice, and I'm quite sure the community will model everything within reach. (Just like wikipedia, lots of users will contribute.)

Tuesday, October 13, 2009

Image recognition with java tool


Neuroph is an opensource tool collection for java, and as you can get from its name, it uses neural networks. In the future, we may use it in one of our sideprojects.
Here is an online demo:
You can get an overview here:
Of course the source code is available, and it's worth checking, if you're really into neural networks.

Tuesday, October 6, 2009

A New Way to 3D Scan Photo-based Scanning - Saves Time and Money

Paper by Alan Walford

I like it. Scanning with photos. :)


"Introduction
Do you need to create dense 3D point clouds and detailed surface models of physical objects, and do you want to do it in a cost-effective and efficient manner? A new class of 3D scanning technologies, called photo-based scanning, may be the solution you are looking for. This new technology uses a standard off-the-shelf digital camera in combination with specialized software that analyzes the digital images - there is no additional hardware required. The new technology is called photo-based scanning, or photogrammetric scanning. In this white paper we define 3D scanning, review the current methods for 3D scanning, introduce photo-based scanning, plus examine strengths and weaknesses of the various technologies."

"How Is Photo-Based Scanning Done?
These are typical steps for executing a 3D scan with a photo-based scanning system:
1. Ensure the object or scene has a suitable pattern or texture on the surface.
2. Ensure good and consistent lighting during photography.
3. If there are no suitable, easily-identifiable points around the scene or object, place some high contrast targets.
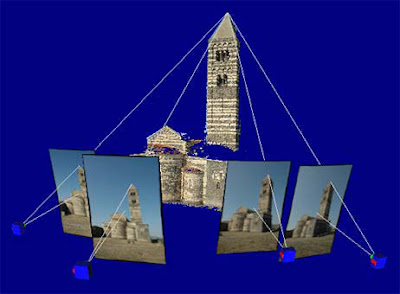
4. Take two or more photographs of the object or scene - these are often taken as pairs with the pair of photographs being close to parallel but separated horizontally.
5. Load the photographs into the photo-based scanning software.
6. In the software perform the orientation step - where the software, using the targets or sharp point markings, solves where the camera was during photography.
7. Initiate the software’s automated scanning/matching step on whole photos or selected sub-regions.
8. The resulting 3D point cloud can be filtered, meshed (to convert to a triangulated surface), or merged with other point clouds.
9. Export the result, perform measurements, or visualize with projected photo-textures.
"

Friday, October 2, 2009

Laser Center in Hungary

"We are supporting it, and giving the needed government guarantees." - said Gordon Bajnai on Saturday (2009.09.26) about ELI (Extreme Light Infrastructure), which may be built at Szeged, Hungary.
The same time, Hungarian government plans to increase R&D money by more than 5% next year.
"We cannot allow the crisis to live up our future." - said Bajnai, Hungaries prime minister.

Radar Map of Buried Mars Layers

http://spacefellowship.com/2009/09/23/radar-map-of-buried-mars-layers-matches-climate-cycles/ Whats laser to Earth, is radar to Mars.

Thursday, October 1, 2009

Google maps for indoors

http://www.smartertechnology.com/c/a/Technology-For-Change/Charting-the-Final-FrontierGoogle-Maps-for-Indoors/

GPS devices to monitor snowfall


A strange feeling is getting stronger and stronger in me: we are able to do anything, we already have the devices, it is only a question of creativity, manpower (engineers power of course), and time. We are just able to do anything.
Way back I read some news about earthquake detecting hard disks, and now this:
http://sciencenow.sciencemag.org/cgi/content/full/2009/929/2

Data sources

A few geographic datasources on the net worth checking:
http://www.openstreetmap.org/
http://www.census.gov/geo/www/tiger/
http://www.geocommons.com/

Detailed photo of a 300 ft tall tree

"...what the photographer ended up doing was building a custom rig containing 3 cameras, each one taking a slightly different shot: one to the left, one to the right, and one on the dead center. The rig was mounted to a gyroscope, and then the cameras took a series of pictures as the rig was lowered to the ground.

The end result: a vertical panorama comprised of 84 pictures, all stitched together to create one of the most complete pictures of a redwood tree we’ve ever seen."

Night sky, milky way

http://www.sergebrunier.com/gallerie/pleinciel/360.swf